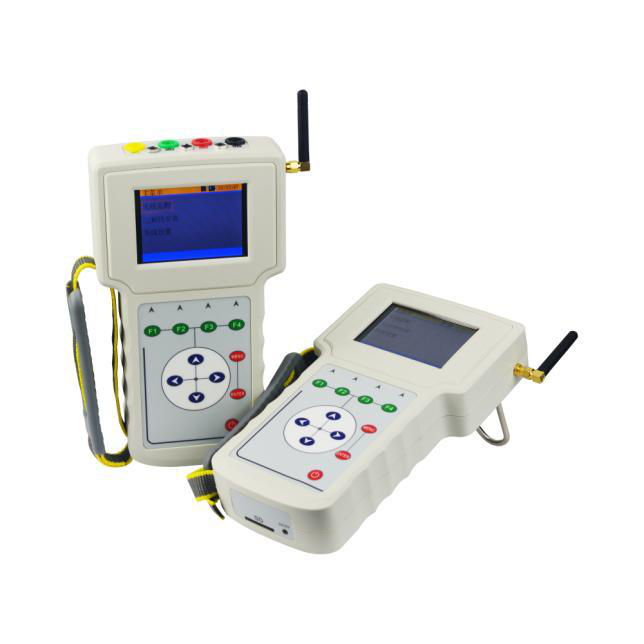
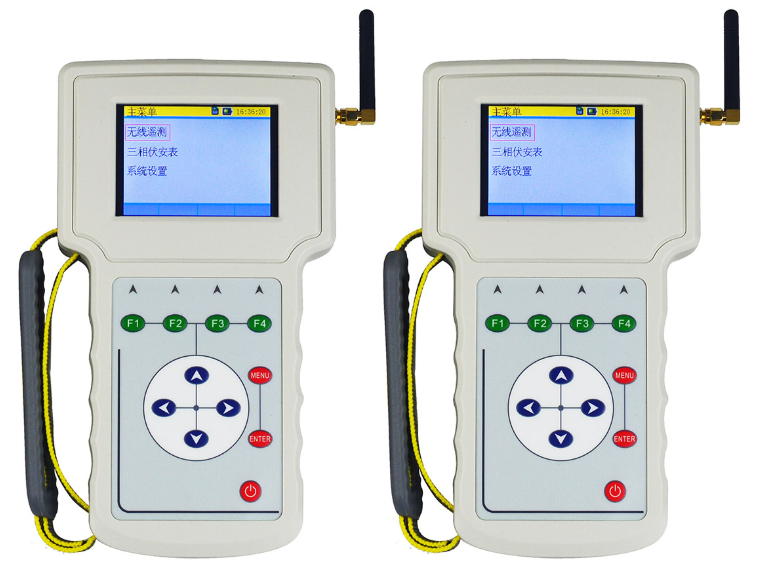
Zc-650 protection loop vector analyzer is also known as six phase protection loop vector tester and loop vector analyzer. It can complete high-precision measurement of three-phase voltage, current, phase, frequency, power, power factor, three-phase imbalance and other electrical parameters with a single host.
In order to facilitate your use, this paper will introduce the vector diagram measurement method of zc-650 protection loop vector analyzer.
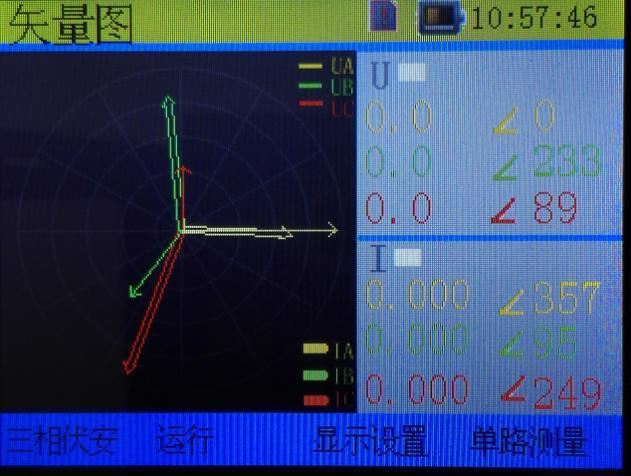
The vector diagram measurement function of zc-650 protection circuit vector analyzer displays the amplitude and phase of three-phase voltage and current in the form of vector (phasor) diagram. The magnitude of the voltage amplitude is proportional to the length of the voltage vector. The magnitude of the current amplitude is proportional to the length of the current vector.
On the right side of the interface, digital display is used to show the amplitude and phase of voltage and current, and automatically judge whether the voltage phase sequence and current phase sequence are correct. The amplitude is represented by a white square, and the phase sequence cannot be determined. The Red Square indicates that the phase sequence is wrong, and the green square indicates that the phase sequence is correct. All vectors are based on UA as phase reference, and the interface is shown in Figure 2:
Figure 2
The following are the specific operation instructions:
Data retention function: the retention function keeps the measured values of parameters on the screen and the vector map unchanged, which is convenient for users to read and analyze. Press F2 key to maintain and cancel the current measurement result.
Switch to the three-phase volt ampere interface: in this interface, press F1 key, and the instrument will return to the three-phase volt ampere interface.
Switch to the single test interface: in this interface, press F4, and the instrument will jump to the single test interface.
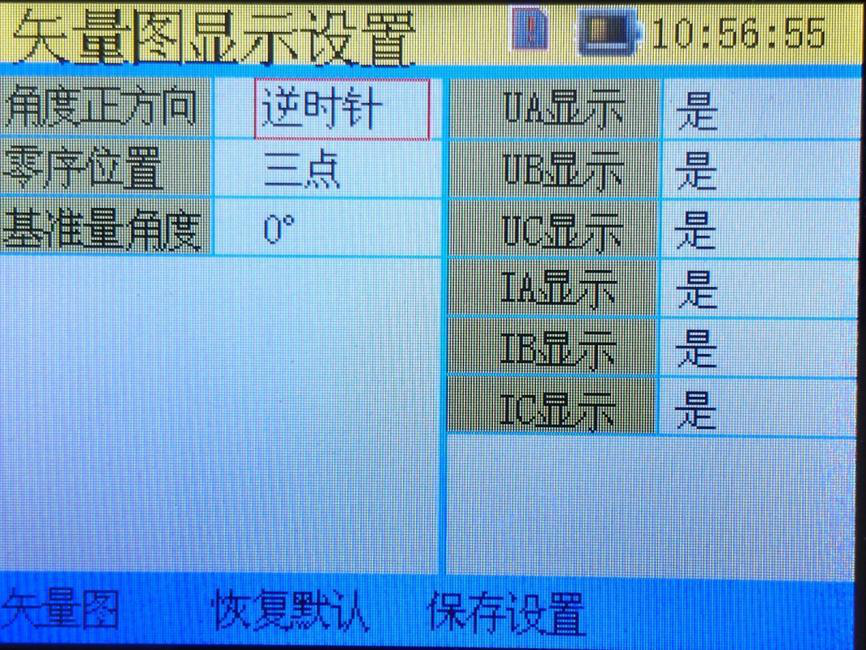
Switch to display setting interface: in this interface, press F3, and the instrument will jump to display setting interface. In this interface, the angle positive direction, zero sequence position, reference angle of vector graph can be realized, and whether UA, UB, UC, IA, IB and IC vectors are displayed. The interface is shown in Figure 5.
Figure 5
Use the ←, → keys to move to the item to be changed, and use the ↑, ↓ keys to change the item options. Due to the different user habits of the electric measurement department and the relay protection department, the way of displaying the vector diagram on different equipment at home and abroad is also different. For the convenience of users, the vector diagram drawing can also be set according to the user habits. The positive direction of the angle can be set as clockwise or anticlockwise, the 0 ° angle can be set as 12 o'clock or 3 o'clock, and the reference value can be set as 0 ° or 330 °.
You can set whether to display UA, UB, UC, IA, IB, IC. After changing the parameter settings, you can press F3 to save the settings, or press F2 to directly reset the default setting parameters, and press F1 to return to the vector diagram interface to view the setting results.
If the angle of the reference quantity is set to 330 °, the angle adjustment of the reference quantity will be displayed as 330 ° when the vector diagram is displayed. The other quantities will be adjusted according to the phase angle between the same reference quantity to ensure the phase relationship between the input quantities. The enhancement of this function facilitates the measurement of three-phase three wire system in the electric energy measurement department.
The above is about the method of vector diagram measurement with zc-650 protection loop vector analyzer. Do you understand? If you have any questions, please contact our online customer service.